EuroVA - 10 Jahre Visual Analytics
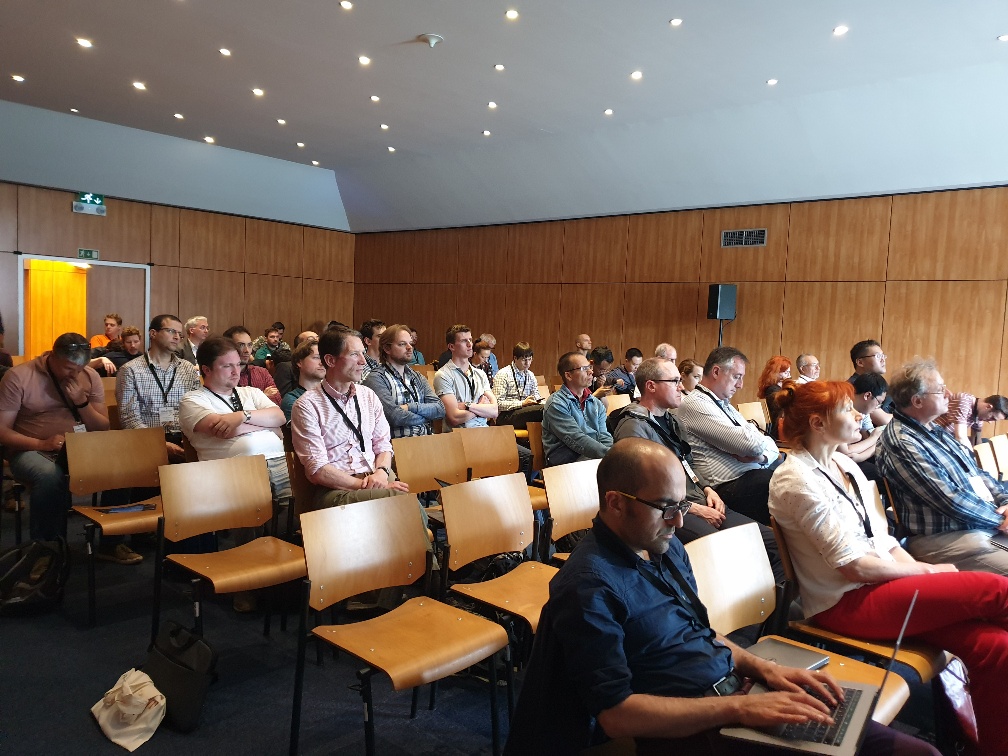
10 Jahre ist es nun schon her, dass unter Mitwirkung von Fraunhofer IGD-Mitarbeitenden der „International EuroVis Workshop on Visual Analytics“ gegründet wurde, kurz: EuroVA. Der Workshop fand parallel zum ersten Öffnungstag der EuroVis 2019 am 3. Juni in Porto statt.

In drei Sessions wurden die eingereichten Papers zu den Themen „Visual Analytics Methods“, „Analyzing Movement and Events“ und „Applications of Visual Analytics“ vorgestellt. In der anschließenden Podiumsdiskussion „The Past, the Present and the Future of Visual Analytics“ nahm Prof. Jörn Kohlhammer, Abteilungsleiter “Informationsvisualisierung” am Fraunhofer IGD, teil. Kohlhammer war an der Gründung der EuroVis beteiligt und diskutierte mit den Visualisierungs-Experten Silvia Miksch (TU Wien), Giuseppe Santucci (Sapienza Universität Rom) sowie Samuel Kaski (Universität Aalto) über die Entwicklung von Visual Analytics.
Die eingereichten Papers unter Beteiligung von Forschern des Fraunhofer-Instituts für Graphische Datenverarbeitung IGD waren:
On Quality Indicators for Progressive Visual Analytics
Autoren: Angelini, Marco; May, Thorsten; Santucci, Giuseppe; Schulz, Hans-Jörg
A key component in using Progressive Visual Analytics (PVA) is to be able to gauge the quality of intermediate analysis outcomes. This is necessary in order to decide whether a current partial outcome is already good enough to cut a long-running computation short and to proceed. To aid in this process, we propose ten fundamental quality indicators that can be computed and displayed to gain a better understanding of the progress of the progression and of the stability and certainty of an intermediate outcome. We further highlight the use of these fundamental indicators to derive other quality indicators, and we show how to apply the indicators in two use cases.
Quantifying Uncertainty in Multivariate Time Series Pre-Processing
Autoren: Bors, Christian; Bernard, Jürgen; Bögl, Markus; Gschwandtner, Theresia; Kohlhammer, Jörn; Miksch, Silvia
In multivariate time series analysis, pre-processing is integral for enabling analysis, but inevitably introduces uncertainty into the data. Enabling the assessment of the uncertainty and allowing uncertainty-aware analysis, the uncertainty needs to be quantified initially. We address this challenge by formalizing the quantification of uncertainty for multivariate time series preprocessing. To tackle the large design space, we elaborate key considerations for quantifying and aggregating uncertainty. We provide an example how the quantified uncertainty is used in a multivariate time series pre-processing application to assess the effectiveness of pre-processing steps and adjust the pipeline to minimize the introduction of uncertainty.
 Fraunhofer-Institut für Graphische Datenverarbeitung IGD